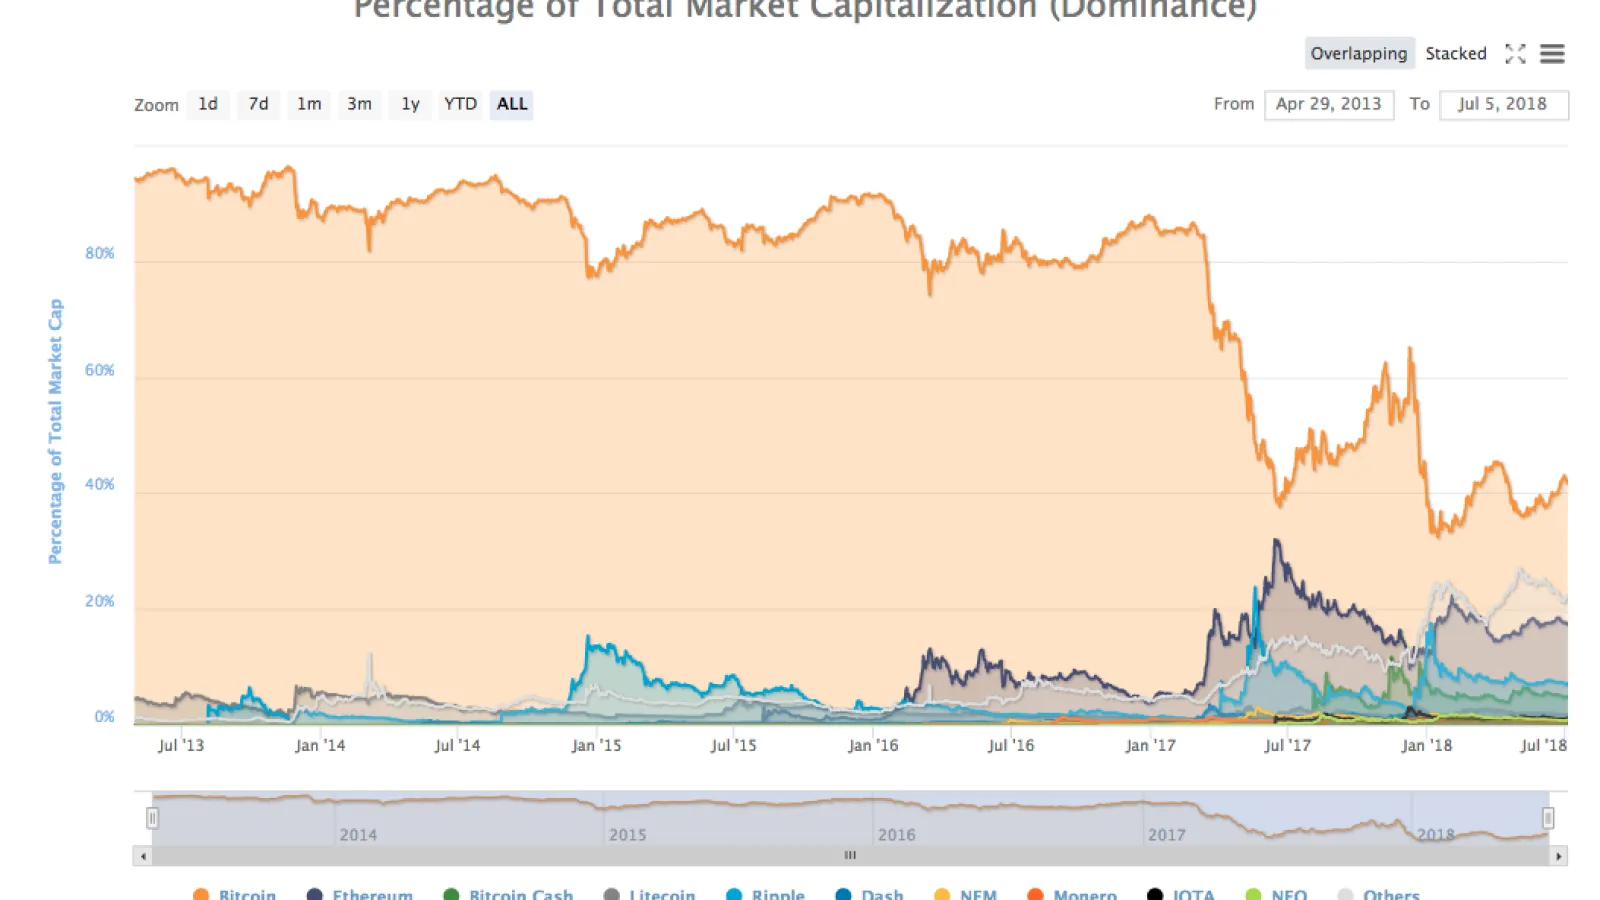

CoinMarketCap(CoinMarketCap) has some global charts which help you get insights into the overall cryptocurrency markets. You can find them on https://coinmarketcap.com/charts/. I was particularly interested in the dominance chart as I was trying to analyze how Bitcoin and Altcoin dominance affects markets and what role it played in important dates in the last year.
Recently when I was trying to do sampling from the above Graph for an article about “Bitcoin Dominance and the Rise of Others” -https://medium.com/@gokulnk/bitcoin-dominance-and-the-emergence-of-others-64a7996272ad it was taking a lot of time to get data and it was really irritating. I had to mouseover on the graph, copy the data manually into the Medium article I was writing. I was using MAC split-screen for the same and it was not easy to switch the focus between the split screens. It only added to the frustration. Comment if you know how to do it.
So I set out to write a small script to fetch the data. Though the script took a little longer than I expected, I think I will save a lot of time going forward whenever I want to do sampling. I am putting out the script so that others also can use it.
dominanceChart = Highcharts.charts[2];
coinsForDominance = ['Bitcoin','Ethereum','Bitcoin Cash', 'Ripple', 'Others'];
datesForDominance = ['Jan 25 2017', 'March 10 2017', 'March 26 2017', 'May 18 2017', 'June 14 2017', 'August 03 2017', 'November 12 2017', 'Dec 8 2017', 'Jan 14 2018', 'May 3 2018'];
coinDateDominanceMatrix = [];
coinsForDominanceData = dominanceChart.series.filter(coin => {return coinsForDominance.indexOf(coin.name) != -1});
csvString = "Date, " + coinsForDominance.join();
firstDateTime = coinsForDominanceData[0].xData[0];
date = new Date(1485242220000);
date.setHours(0);
date.setMinutes(0);
date.setSeconds(0);
date.setMilliseconds(0);
difference = firstDateTime - date.getTime();

datesForDominance.forEach(function(relevantDate){
    csvString+= "\n" + relevantDate + ", ";
    coinDateDominanceMatrix[relevantDate] = [];
    coinsForDominanceData.forEach(function(coin){
        timestring = Date.parse(relevantDate)+difference;
        coinDominance = coin.yData[coin.xData.indexOf(timestring)];
        var dominanceValue = Math.round(coinDominance * 100) / 100;
        coinDateDominanceMatrix[relevantDate][coin.name]= dominanceValue;
        csvString+=dominanceValue + ", ";
    });
});
console.table(coinDateDominanceMatrix);
console.log(csvString);
Just visit the page https://coinmarketcap.com/charts/ and copy-paste the following code into the console to get the relevant data. You can also edit coinsForDominanceand datesForDominancevariables to get the data that you need.
Let me know if it helped you.
Originally published on https://hackernoon.com/sample-data-from-bitcoin-dominance-chart-on-coin…