
Drupalgeddon 2.0 brought a lot of focus on the Drupal security initiative and its practices. The way the security team disclosed this vulnerability and communicated to developers, community and press were proactive and commendable. Further, the communication was continuous.
The vulnerability, which started off with a risk score of 21/25 on 28th March, was upgraded to 22/25 on 13th April and was finally marked as 24/25 on 14th April. If you are interested to know what was changed during this interval - you can check out the revisions and compare them yourself here.
One thing we observed, recently, that in spite of all these disclosure and announcements not many Drupalers were aware of the details and terminology. Though security risk levels were well defined on Security Risk Level Definitions Page, it looked like not many are reading it in detail. This intuition is based on a sample survey of around 100 developers from three different cities in India. While it may not be an actual representation it still highlights a problem that needs to be addressed. It would be great if Drupal Association adds this question on one of their surveys.
“Have you read defined security risk levels” with options of Yes and No.
This may give us more insights. If developers themselves are not aware of these details then I believe it is too much to expect from site-builders to take corrective actions. So we created a crude static file that can make it easy for humans to understand - what the security string like 24∕25 AC:None/A:None/CI:All/II:All/E:Exploit/TD:Default means. While the security score is pretty much self-explanatory it is the second part that generally stumps many people.
You can check it out on https://nkgokul.github.io/drupalsecurity/. Once you enter the security string like “24∕25 AC:None/A:None/CI:All/II:All/E:Exploit/TD:Default” it will give a description that humans can easily understand. It is a very crude version without any validations. Would be great if anybody can clean it up.
Once this was done we wanted to do a basic analysis to figure out - how Security Advisories have been released till date? and what were the security scores of each of these advisories? Though official Security track record has some details, it was not up to date and was not in detail. So we set out to gather the data. Though there were various API endpoints like
https://www.drupal.org/api-d7/node.json?type=sa&status=1
https://www.drupal.org/api-d7/node.json?taxonomy_forums=1852
https://www.drupal.org/api-d7/node.json?taxonomy_forums=1856
We felt it was too much of work to normalize the data from these endpoints. So we took a different approach to scrape the data from security advisories. Just to let you know it was not a straightforward job and was not as easy as we initially thought it would be. We scraped the advisories using our good old Google docs and some queries.
Since the data was inconsistent we had to use different queries based on the different time windows during which these announcements were made. After doing an initial round of scraping we did some data manipulations to get all the relevant data in the format we required.
The next challenge was that two different formats were used while sharing the security advisories. Post 6th August 2014 NIST Common Misuse Scoring System (NISTIR 7864) mechanism was used for categorizing the vulnerabilities and scoring them so that the data should be structured properly. Before that Drupal team had its own way of classifying the vulnerabilities.
You can read about security risk levels at Drupal.org
In order to have meaningful insights, we gave the security risk score for vulnerabilities that were reported prior to 6th August 2014. So based on the new guidelines and the security risk level assigned to the vulnerabilities, announced before the date, we did a reverse mapping.
For highly critical we gave a rating of 22.5, Critical - 17, Moderately Critical - 12, Less Critical - 7 and Not Critical - 2.
Though these numbers were not accurate, they gave us a broad sense. To have an exact scoring we need to have a rating for each of the six risk metrics defined in NISTIR 7864. This can be time-consuming. Hence we put it on hold for now. It would be great if somebody can rate the old SAs as per the new guidelines. If you would like to take a dig at it you are free to do it here - Drupal core vulnerability analysis. All users have edit access. So please go ahead and update the Columns H to M that are marked in orange color and have the text “Details not available”. Once you are done with it you can also update the column G and you can use these values in https://security.drupal.org/riskcalc to find out the Risk Score.
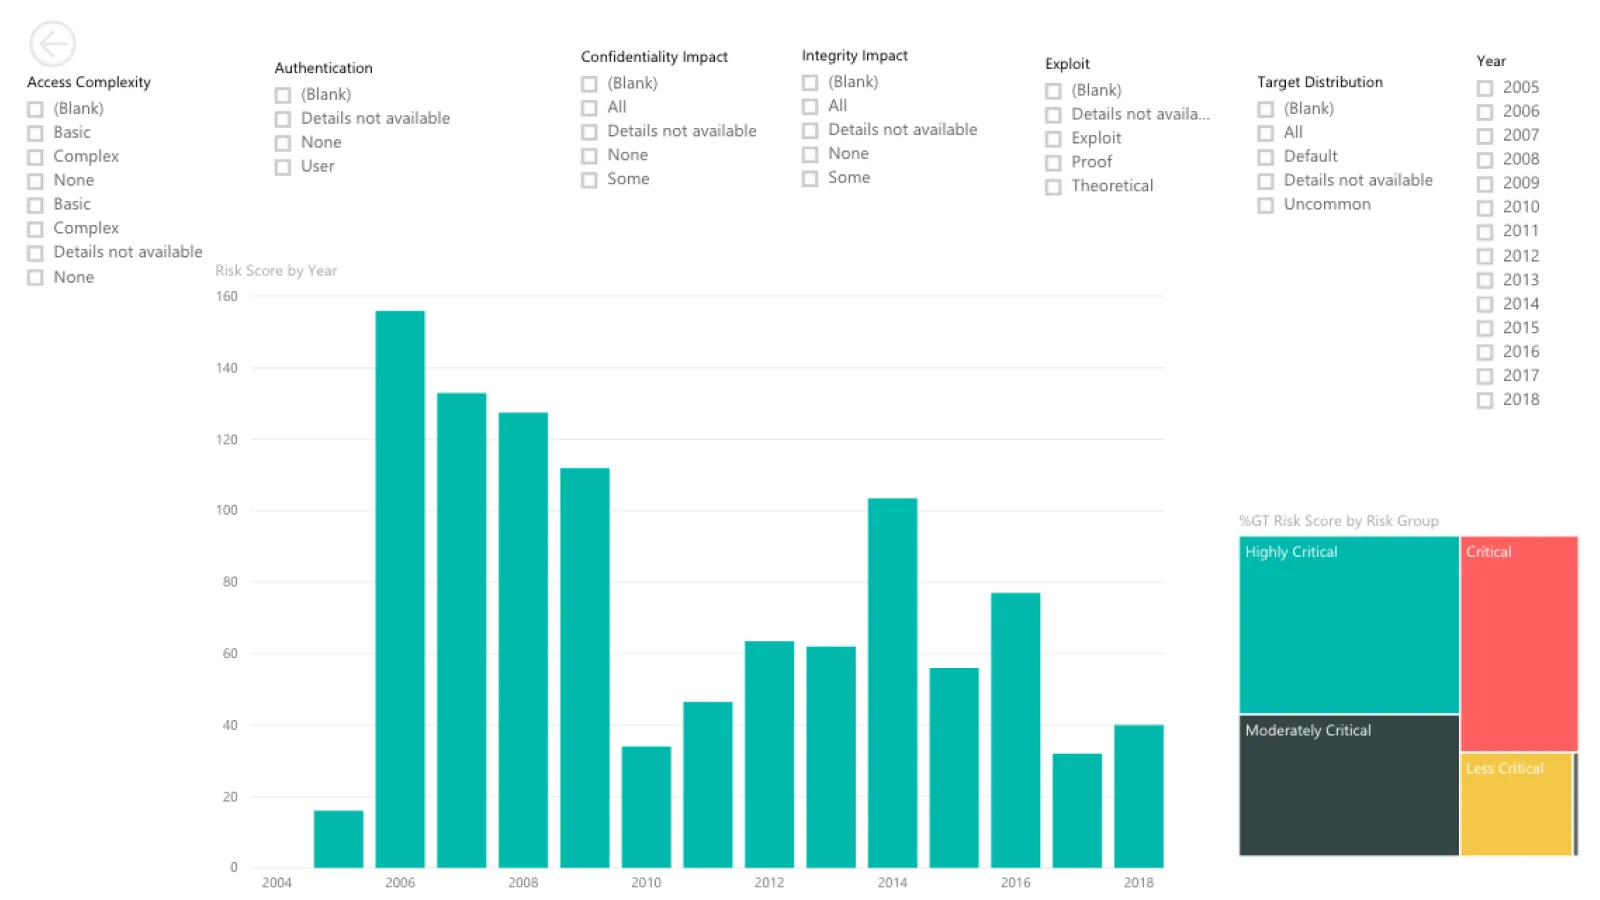
With the data currently available, we made some visualizations. Have a look.

This was created using Google spreadsheet. As you can see the number of SAs have reduced over the time and it is especially interesting to note that vulnerabilities with the score less than 10 have minimized drastically post January 2010. I am not sure if this could be attributed to automation tools that were around that time.
Using the data from Google spreadsheets, we created a couple of interactive maps in PowerBI.


You can check out these interactive maps here.
Special thanks to Gokul for contributions to this blog post.